Risk Aversion
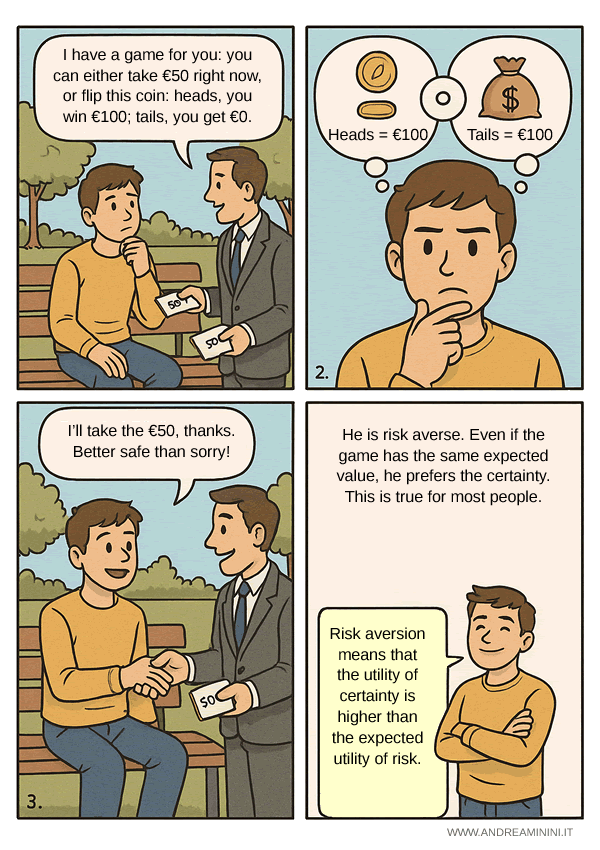
Risk aversion is the tendency to prefer certainty over uncertainty - even when the potential payoff is the same.
Sounds familiar? Think about it: would you rather take a guaranteed €45 or flip a coin for a 50/50 shot at €100? If you chose the €45, you’re not alone - and you’re risk-averse.
Note. Risk aversion is a key idea in behavioral economics and decision theory. It helps explain why people buy insurance, shy away from volatile markets, and make conservative financial choices.
Expected Value vs. Expected Utility
Let’s break it down with a simple lottery example. Suppose you have two possible outcomes, $X_1$ and $X_2$, with respective probabilities $p_1$ and $p_2$, where $p_1 + p_2 = 1$.
The expected value of the lottery is:
$$ E(X) = p_1 \cdot X_1 + p_2 \cdot X_2 $$
The expected utility is:
$$ E(U) = p_1 \cdot U(X_1) + p_2 \cdot U(X_2) $$
Now here’s the twist: if the utility of the expected value is greater than the expected utility, we have:
$$ U(E(X)) > E(U) $$
That’s the definition of risk aversion: the preference for the sure thing.
Other Possibilities
- If $U(E(X)) = E(U)$, you’re risk-neutral - you don’t mind taking chances.
- If $U(E(X)) < E(U)$, you’re risk-seeking - you prefer the gamble, even with a lower expected value.
Real-Life Example
Imagine a game where you have a 50% chance to win €100, and 50% chance to win nothing. The expected value is:
$$ E(X) = 0.5 \cdot 100 + 0.5 \cdot 0 = €50 $$
If you’d rather take €45 for sure, you’re paying €5 to avoid the risk. That’s your risk premium: what certainty is worth to you.
Visualizing Risk Aversion
Plot wealth $x$ on the horizontal axis and utility $U(x)$ on the vertical. The red curve? That’s the utility function of a risk-averse person - concave, showing diminishing returns: every extra euro is worth a little less.
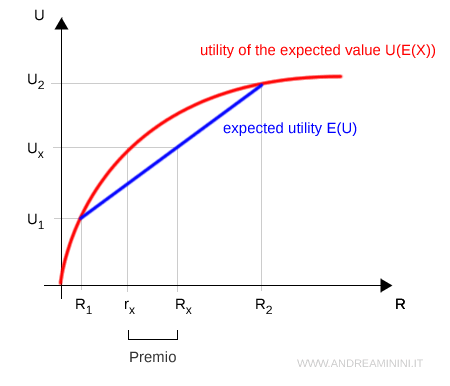
The blue line represents the expected utility of the lottery, and the gap between the expected value $Rx$ and the certainty equivalent $rx$ is the risk premium - how much value you’re willing to sacrifice for peace of mind.
Mathematically:
$$ U(Rx) > p \cdot U(R_1) + (1-p) \cdot U(R_2) $$
Note. The greater the gap between $E(X)$ and the certainty equivalent, the more risk-averse the person is. If the curve were a straight line, we’d be looking at risk neutrality. If it curved the other way - convexity - we’d be in risk-seeking territory.
This chart captures something deeply human: the cost of uncertainty isn’t just financial - it’s psychological.
Why Are We So Afraid of Risk?
Under the classical model (expected utility theory), a risk-averse person will take a lower guaranteed return over a gamble with the same expected value.
But why? Because loss hurts. More than gain feels good. It’s not just rational calculation - it’s instinct.
Example. Someone may decline a promotion if it brings uncertainty and stress, even if it also brings a higher salary. That’s risk aversion in action.
What Kahneman Taught Us
Daniel Kahneman, Nobel Laureate, changed the game with his Prospect Theory. He showed that people don’t assess outcomes in absolute terms, but relative to a reference point - often, the status quo.
This leads to loss aversion: the tendency to weigh losses more heavily than equivalent gains.
Losing €100 hurts more than gaining €100 feels good. It’s irrational - but it’s how most of us are wired.
People aren’t always consistent or logical. Our preferences shift depending on context, emotion, and how choices are framed.
Note. Prospect Theory is a cornerstone of behavioral economics. It’s not just about money - it explains how we decide, how we err, and how we live in a world full of risk.
Risk and Wealth
Here’s the good news: as wealth increases, risk aversion tends to decrease. Why? Because each additional euro is worth less to someone who already has plenty.
And if you’re financially comfortable, you can weather a loss - it won’t derail your life.
Example. An entrepreneur with €10 million might take a €100,000 risk. Someone with just €10,000 would likely hesitate to risk even €1,000.
Absolute vs. Relative Risk Aversion
Economists use two measures to describe risk preferences:
1. Absolute Risk Aversion (ARA)
This tells us how much someone dislikes risk, regardless of how rich they are:
$$ A(x) = -\frac{U''(x)}{U'(x)} $$
- If $A(x) > 0$, you’re risk-averse.
- If $A(x) = 0$, you’re risk-neutral.
- If $A(x) < 0$, you’re a risk-seeker (think: gambling your rent on crypto).
ARA measures how much you'd pay to eliminate risk at a given wealth level. The higher it is, the more cautious you are.
2. Relative Risk Aversion (RRA)
This takes your wealth into account:
$$ R(x) = -x \cdot \frac{U''(x)}{U'(x)} = x \cdot A(x) $$
- If R(x) is constant, doubling your wealth doubles the risk you’re willing to take.
- If R(x) rises with wealth, you become more cautious as you get richer.
- If R(x) falls with wealth, you loosen up financially as your cushion grows - which is more realistic for most people.
Bottom line? Risk aversion is dynamic. It evolves with context, emotion, and financial status.