Marginal Utility
Marginal utility (MU) refers to the additional satisfaction or benefit a consumer receives from consuming one more unit of a good or service. $$ MU = \frac{dU}{dx} $$ Here, x is the quantity consumed, and U represents total utility.
It’s a core concept in microeconomics - and a powerful tool for understanding how we make choices as consumers.
Put simply, it’s the extra value or pleasure you get from “just one more” of something.
For example, if I eat an apple, MU is the enjoyment from that apple. If I eat a second, MU is the difference in satisfaction between the first and second apple.
But here's the catch: the more you consume, the less extra satisfaction you tend to get. This is called the law of diminishing marginal utility.
Even if you love apples, by the sixth one in a row... your enthusiasm starts to fade.
That’s because marginal utility tends to decline as you consume more of the same good.
Here’s a relatable real-world example. Picture this: you’ve just finished a long, hot run. You’re thirsty.
Your first glass of water? Absolute bliss. Life-saving. MU = 10.

The second glass still feels good - but not quite like the first. MU = 5.

The third one? Nice, but now you're just topping off. MU = 3.

And it keeps dropping. The fourth, fifth, sixth glasses add less and less satisfaction.

By the seventh, you’re forcing it down. MU is basically zero - or even negative if it starts to feel uncomfortable.
Visualizing Marginal Utility
You can chart marginal utility on a simple graph. The x-axis shows quantity consumed, the y-axis shows marginal utility.
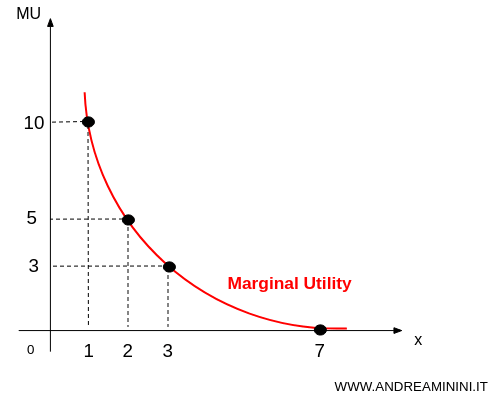
Notice how the curve slopes downward? That’s diminishing marginal utility in action: each extra unit gives you less than the one before.
More doesn’t always mean better - especially when it comes to satisfaction.
Total Utility: Growing, But Slowing
This principle also affects total utility - the overall satisfaction you get from consuming multiple units of a good.
Yes, total utility increases as you consume more. But because MU is falling, it grows more slowly with each unit.
The graph ends up being concave - rising at a decreasing rate.
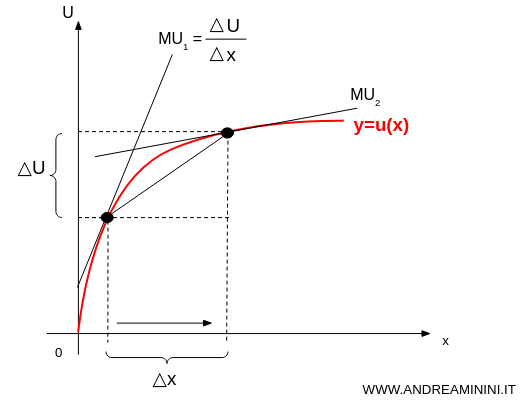
Mathematically:
$$ u'(x) > 0 $$
$$ u''(x) < 0 $$
Let’s say: first glass = 10 units of utility, second = 5, third = 3. Total utility is 18. Not bad, but you can see the slowdown.
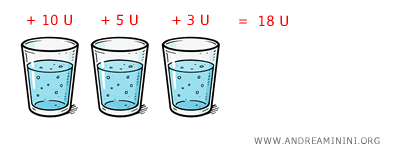
So yes, you’re getting more satisfaction - but at a diminishing pace.
How Marginal Utility Shapes Indifference Curves
Marginal utility also explains why indifference curves are convex.
These curves show combinations of goods that deliver the same overall satisfaction to a consumer.
The convex shape comes from diminishing MU: we tend to prefer variety over overload.
Say you’re choosing between apples (x1) and pears (x2). A balanced mix is more appealing than a huge pile of just one fruit.
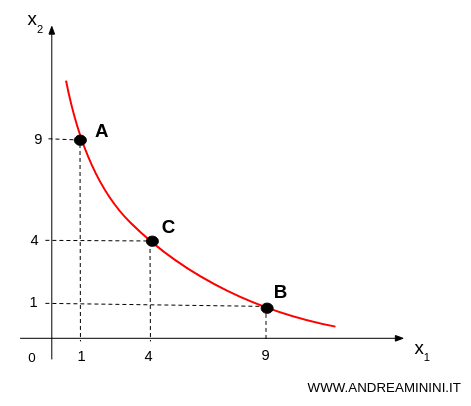
In other words: 4 apples and 4 pears (point C) beats 9 apples and 1 pear (point B), or 9 pears and 1 apple (point A).
Unless you absolutely hate pears, balance wins every time.
Marginal Utility and Price
Marginal utility isn’t just theoretical - it ties directly into the price of goods.
When MU is high, you’re willing to pay more. When it drops, so does the price you’re willing to accept.
That’s why scarcity boosts marginal utility, and why markets respond to scarcity with higher prices.
Take your first cup of coffee in the morning: totally worth the wait and the price. High MU, high value. By the third cup? Even if a friend offers to buy, you might pass.
Bottom line: not all units of the same good are created equal. The first slice of cake hits the spot. The second is indulgent. The third? Regret.
This concept is central to how we behave as consumers, how prices are set, and how markets operate.
