Utility Function
The utility function is a key concept in economics that helps us understand how consumers make choices. It assigns a number to each possible bundle of goods, reflecting how satisfied a consumer feels with that combination. \[ U = U(x_1, x_2, \dots, x_n) \] Here, \(x_1, x_2, ..., x_n\) represent the quantities of each good consumed.
In essence, utility functions help economists - and decision-making systems - analyze and predict consumer behavior.
Though simple in form, the utility function offers a powerful framework for representing individual preferences in a structured way.
Why does it matter? Utility functions allow us to compare different bundles of goods, draw indifference curves, and model rational decision-making - both in economics and in fields like AI. If you're studying microeconomics or working with automated systems, understanding utility is a must.
How It Works
A utility function links each bundle of goods to a number that captures how much the consumer values it. There are two main ways to interpret that number:
- Ordinal utility: tells us which bundles are preferred, but not by how much.
- Cardinal utility: tells us both the order and the strength of the consumer’s preferences.
For example, say a consumer gives bundle A a utility of 10 and bundle B a 9. That means A is preferred. If the utility is ordinal, we just know A ranks above B because 10 > 9. But if it's cardinal, we can say A is only slightly better - just 1 unit more satisfying.
The Math Behind It
A utility function typically looks like this:
\[ U = U(x_1, x_2, \dots, x_n) \]
where each \(x_i\) is the amount of a specific good. The function returns the total satisfaction a consumer gets from consuming those goods.
Example. Imagine a consumer buying bread (\(x_1\)) and milk (\(x_2\)). Their preferences might be captured by: \[ U(x_1, x_2) = x_1^{0.5} \cdot x_2^{0.5} \] This form suggests the consumer values a balanced mix of bread and milk.
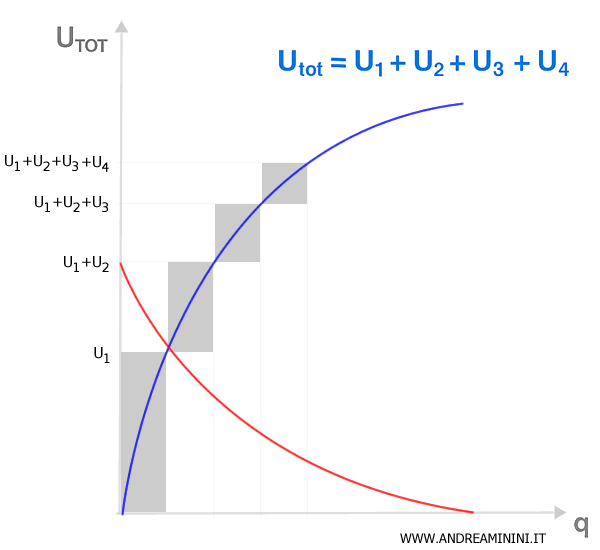
The graph of a utility function typically slopes upward - the more you consume, the more utility you get.

That said, utility doesn’t increase forever. Each additional unit of a good adds less and less satisfaction - a principle known as the law of diminishing marginal utility.
Comparing Bundles
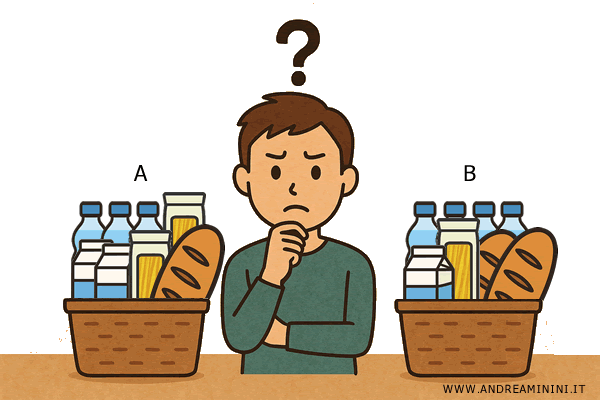
Now let’s say a consumer is deciding between two bundles, each containing different quantities of the same goods.
For instance:
- A = (2 cartons of milk, 1 kg of bread, 2 kg of pasta, 3 liters of water)
- B = (1 carton of milk, 2 kg of bread, 1 kg of pasta, 4 liters of water)
Both bundles include the same items, just in different proportions.

The utility function helps us determine which bundle the consumer prefers:
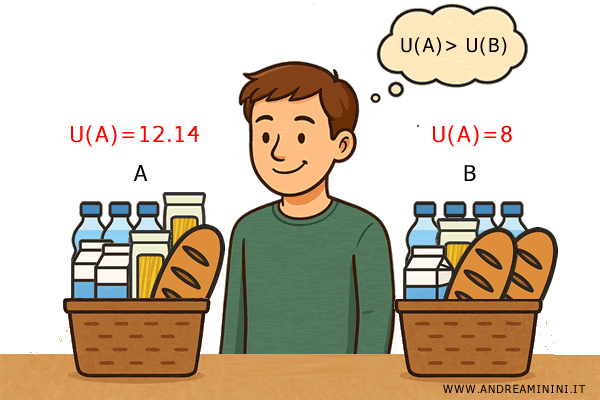
- If \(U(A) > U(B)\), A is preferred
- If \(U(A) < U(B)\), B is preferred
- If \(U(A) = U(B)\), the consumer is indifferent
Example. Suppose the utility function is: \[ U(x_1, x_2, x_3, x_4) = x_1^{0.5} \cdot x_2^{2} \cdot x_3^{3} \cdot x_4^{0.5} \] where x1 is milk, x2 is bread, x3 is pasta, and x4 is water. Plugging in the values from the two bundles gives: $$ U(A) = 2^{0.5}+1^2+2^3+3^{0.5} = 12.14 $$ $$ U(B) = 1^{0.5}+2^2+1^3+4^{0.5} = 8 $$ So, A provides more utility than B, and the consumer would choose A.

It’s important to note that preferences vary from person to person. What works for one consumer might not work for another.
That’s why there’s no one-size-fits-all utility function - each consumer has their own.
Indifference Curves
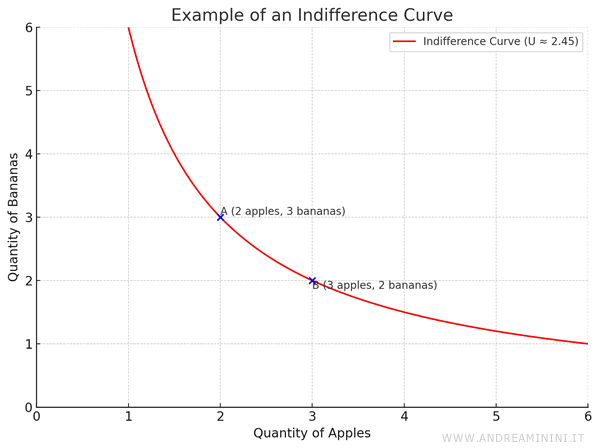
Bundles that yield the same level of satisfaction form what's called an indifference curve.
Every point on the curve represents a different bundle that the consumer values equally.
Example. Say a consumer is just as happy with bundle A (2 apples and 3 bananas) as with bundle B (3 apples and 2 bananas). That means both lie on the same indifference curve.

Other combinations - like 6 apples and 1 banana, or 6 bananas and 1 apple - may also fall on that same curve if they provide the same level of satisfaction.
Indifference curves offer a visual way to explore how people make trade-offs between goods without changing their overall satisfaction.
Further Thoughts
Here are a few additional insights:
- Beyond Economics
Utility functions aren’t just for economists. They’re used in fields like artificial intelligence to model decision-making. For example, an intelligent system can evaluate possible actions based on which one is expected to produce the highest utility.Real-world example. A home robot might choose whether to clean, recharge, or rest by assigning a utility score to each option, depending on the state of the house and its battery level.
And so on.
